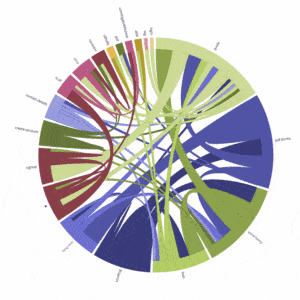
One of the several visualisations available in Reframer: The chord lines that connect the tag nodes represent observations that contain both tags. The thicker the chord, the more times the two tags appear together on the same observation. Source: Optimal Workshop
One of the several visualisations available in Reframer: The chord lines that connect the tag nodes represent observations that contain both tags. The thicker the chord, the more times the two tags appear together on the same observation. Source: Optimal Workshop


