Surveys are an essential tool in the UX research toolkit. When done well, they deliver incredible insights into how people use your product. They are particularly helpful if you’re looking for feedback from many users, or people across locations. With an array of easy to use digital tools like SurveyMonkey at our fingertips, executing a survey is relatively simple.
But the actual survey design is where it gets complicated. If you’ve ever created a survey, you know it’s not as simple as it seems at first glance. In fact, carefully designing a survey that meets your research objectives can take months.
How do you keep your survey short enough to get responses, but long enough to provide useful insights? Are you sure your question wording is clear and unambiguous? What question formats do you use to get meaningful answers? How do you strike the right balance between open-ended and closed responses?
In my experience in consulting and teaching survey design, these are common problems for people new to survey design. To keep you on the right path, here are my seven top strategies to design an effective survey.
Think before you write: Research objectives, attributes, then questions
If the first step in your survey project is to start writing questions, you’re off to a bad start. The first step in the questionnaire design process is to review your research objectives from the planning stage and then think about the attributes you want to measure in the survey.
Attributes are characteristics of whatever it is you’re trying to understand – whether that’s customer, employee or user experience – or whatever. When you’ve identified the attributes of interest, then you can start writing survey questions that generate data to measure those attributes.
For example, let’s say you are a hotel manager and you want to know how well your hotel is doing. Your research objectives may be to understand your guests’ views about their hotel experiences and to understand why drives them to be loyal or not.
The attributes of a hotel stay are: making the reservation, checking in upon arrival; room characteristics such as bed comfort, climate control, noise, working condition of items in the room, cleanliness, amenities; general hotel appearance, fitness center, business center, restaurant, catering services, checking out, and billing.
You can see that even for a simple hotel stay, the list of attributes gets quite long. Now we’re in a position to think about how to pose questions to our audience to capture data that measure their experiences.
Get out of your comfort zone: Go to the source
The worst kinds of surveys are like mushrooms – created in isolation by one person, and not brought into the light for contributions from others. Most people designing surveys for the first time will go beyond the ‘mushroom stage’ and get input from a project team in brainstorming sessions. Great. You’re not a mushroom, but this process still suffers from internal blinders.

You think you know the concerns of the group whose views you are researching. But do you? Consider conducting some research, for example, interviews, with your research audience to learn from them their concerns. This is valuable information in itself, and this research will identify attributes to measure on the survey that you may never have considered.
For example, look at my list of hotel stay attributes. Think about your hotel experiences. Anything missing? How about security? The hotel manager may assume they’re creating a secure environment for their guests, but maybe a guest noticed something – people hanging around the entrance or broken window latches.
The shiny penny syndrome
Think outside the survey box. Make sure you consider whether a survey is, in fact, your best research approach. If you’re researching a small group, then personal interviews may be a better approach. If you’re looking to research further issues raised in the survey results, you may be tempted to do a follow-up survey; whereas, interviews may be the better approach. Some people treat surveys like a shiny penny, and the only tool to be applied in any and all circumstances. It’s not. Get the right tool for the job.
Design a good instrument
A well-designed instrument, or questionnaire, is a bit of an art. You’re engaged in a balancing act. You want enough comprehensive data for your analysis, but you want to limit ‘respondent burden’. A survey that takes too much energy to complete leads to lower response rates. Keep the burden on the respondent as low as possible, yet enough to achieve your research objectives. As you design the survey, always think about the work you’re asking the respondent to do.
Most importantly, the survey instrument should engage the respondent in order to get a full response, an honest response, and ongoing participation. Some basic rules are:
- Keep it short. If you can’t take action on the findings from some question, then why are you asking it?
- Make it relevant. Ideally, all the questions in the survey should be relevant to the invitee. That’s hard to achieve 100%, even using branching logic to tailor questions based on how they answer the current question. But lots of irrelevant questions lead to a non-response.
- Practice Poka-Yoke. That’s a Japanese quality control term for “mistake-proofing”. Design the instrument so respondents are unlikely to make mistakes. For example, a question with a double negative will confuse the respondent, or a poorly presented rating scale could lead the respondent to invert the scale.
- Organise your survey into sections. Topical sections keep the respondent focused on the topic, and make a survey feel shorter. Have a flow across sections that makes sense to the respondent.
- Put yourself in the respondents’ shoes. Beware of common question writing mistakes. A number of common question writing mistakes exist. These mistakes may mean the data submitted by the respondents do not represent their views. The biggest mistake is ambiguity in what the question is asking. Our goal is a common interpretation of every question by every respondent. If different respondents have different interpretations of a question, how can we interpret the data? Imprecise wording, jargon, convoluted phrasing, loaded wording, and double-barreled questions all introduce ambiguity, making the data collected invalid.
- Don’t rely on open-ended questions. Free-form text questions have their place in a survey to get more granular detail, but over-reliance on this question form introduces respondent burden, administrative burden, and analytical burden. Better to use well-designed closed-ended questions – questions that yield a number or a check as the response – since these questions are far easier for the respondent to answer and for you to analyse.
Not all question formats are created equal
The question format you use will determine the type of data generated – nominal, ordinal, interval, or ratio. The data type limits the statistical analysis you can perform.
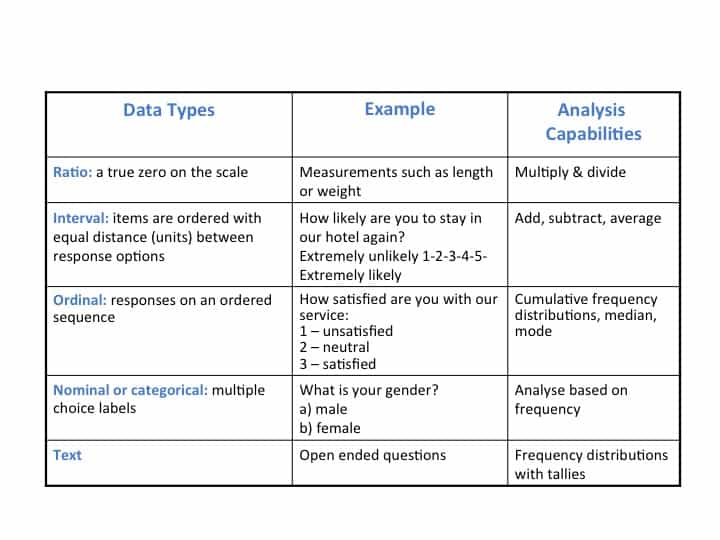
The data type limits the statistical analysis you can perform. Interval rating questions are most commonly used in surveys, but other question types might generate more useful data for your analysis. Become familiar with all the question formats and consider their analysis potential for your research objectives.
A sheep in wolf’s clothing: An ‘ordinal’ question pretending to be ‘interval’
The most commonly used question type is the interval rating scale question for which we can take averages and do other advanced analysis. The design of interval questions (for example a 1-5 or 1-10 ranking) require a consistent unit of measurement across the points on the scale, i.e. the distance between scale points should all be the same.
Poor choice of anchors – the words that describe the scale – and how the scale is presented can corrupt the interval properties, and make the statistical analysis incorrect. Interval rating scales should also be balanced, that is, we shouldn’t be directing the respondent toward a positive response.
Get the respondent to consider trade-offs
In almost all surveys, we want to learn the relative importance of factors in a respondent’s decision-making. For example, what drove their satisfaction or dissatisfaction? This isn’t news for UX designers, as understanding ‘why’ is a fundamental part of the job.
Rating scale questions for example, are unsuited for this, because the respondent can just say everything is important. Consider using fixed-sum questions or ranking questions to get the respondent to tell you what’s really the most important. Ranking questions ask the respondent to put a set of items in order of importance. Fixed-sum questions may use that same list of items but ask the respondent to apportion 100 points across the items to indicate relative importance.
Next time you need a better insight into your users or audience, consider using a survey. With the tips you’ll be collecting useful, qualitative data for analysis and design in no time.
What’s your advice for designing effective surveys? Let us know in the forums!